01
Step one
Name the decision in front of you
Sponsor renewal, higher package pricing, a funder update, a board readout, a venue decision, or next-event planning. Everything is built around that decision.
Bring us the ticketing, surveys, sales, social posts, sponsor notes, and anything else you have. We sort through it, fill gaps only when needed, and build a report your sponsor, funder, venue, or board can actually use.
Book a scoping call →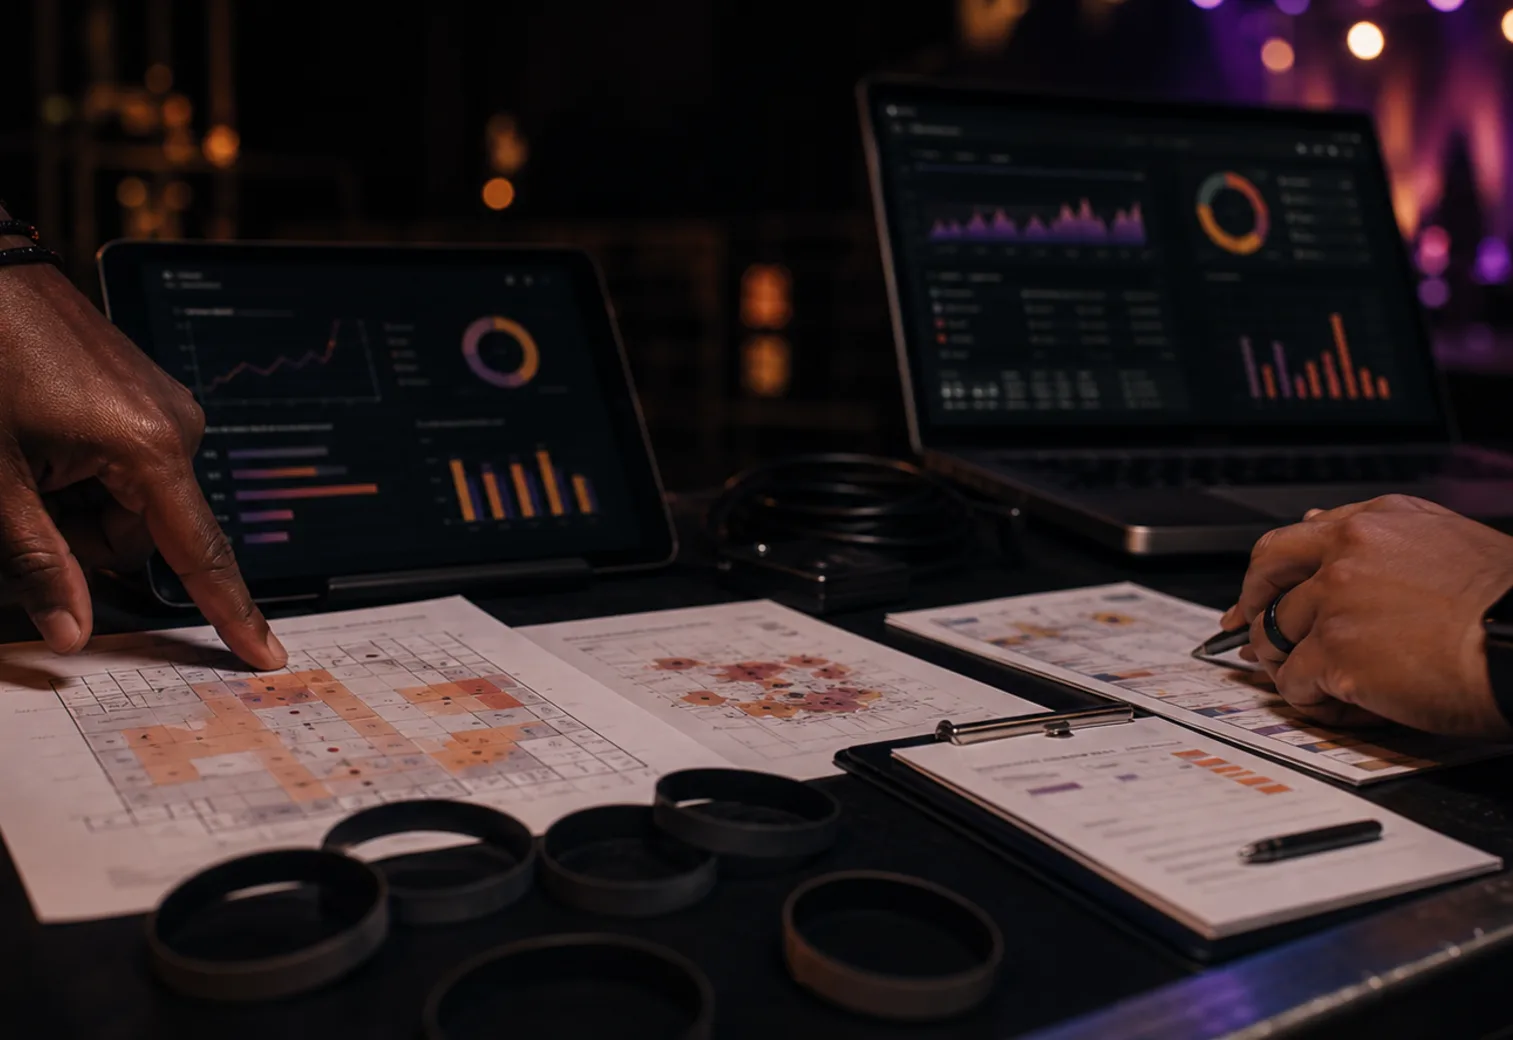
The depth scales with the job, but the path stays the same. It starts with the decision in front of you and ends with a clearer plan for the next event.
No new software to adopt. We work from the records you already generate. Most organizers have more than they think.
Purchase timing, tiers, repeat attendance, total footfall.
Satisfaction drivers, demographics, open-ended sentiment.
Reach, attendee-generated content, genuine amplification.
Transaction volume, basket size, spend per head, product mix.
Prior recap decks, sponsor reports, photo records.
List growth, segment behavior, campaign performance.
Some event stories need room-level capture that the existing data cannot supply. When they do, we add a physical layer through trusted sensor partners, scoped to the part of the room and the decision that matters.
Physical measurement is optional and scoped. We use it only when the next conversation depends on what happened in the room, and only at the granularity the report requires.
Sensing is environmental and passive. Trained field operators are the second layer. Everything is captured in aggregate, never tied to an individual. Patterns, not people.
Every figure in an Octus report carries one of three badges. A sponsor or funder's analyst can see, at a glance, which numbers are observed, which are derived, and which are modeled.
Counted, sensed, or collected on the record. The hard floor of every report.
Built from measured data using transparent formulas you can follow input by input.
Inferred from partial data, with every assumption named in the appendix.
Every engagement ends in a signed report written to be forwarded, read, and acted on by the people you need to convince. Each one explains the sources and how the numbers were produced.
A signed read on what a sponsor received, built for the renewal meeting.
Who showed up, how they behaved, and why they are worth a budget.
Impact framed for grant officers, with sources and clear limits behind the numbers.
The value each partner drew, in terms their leadership recognizes.
What to change, keep, or expand before the next edition.
Clean, on-brand proof for partners, press, and your board.
We measure communities in aggregate. The unit of analysis is the room, the zone, the segment, never the individual.
Sensing is environmental and passive. There is no individual tracking, no surveillance, and no selling of personal data. Field evidence is captured and reported as patterns.
The people who show up to an event are the reason it has value. Better proof should mean better events for them, not closer watching of them.
Tell us what happened, who needs the report, and what you need it to help you do. We will tell you what information would help and what it would cost.
Book a scoping call →